We created a “Deep Earth Explorers” research exhibition with the Sedgwick Museum of Earth Sciences in order to communicate our team’s current research. First of all we used a Science Capital approach to inform the design of the exhibition. However, evaluation was also key for this process. We designed the exhibits as a multi-way process between the research team, museum staff, museum public, and professional model makers. Overall, this took place over a nine-month period. By undertaking this evaluation we ensured its accessibility to members of the general museum public.
3D Earth model

The 3D Earth model has moveable layers which can be read like a book, revealing more details about the hidden nature of the deep Earth. The model was designed by Amalgam Model Makers, working with the ideas of the research team and museum staff. Early concepts were tested on the museum public.
Explaining Waves
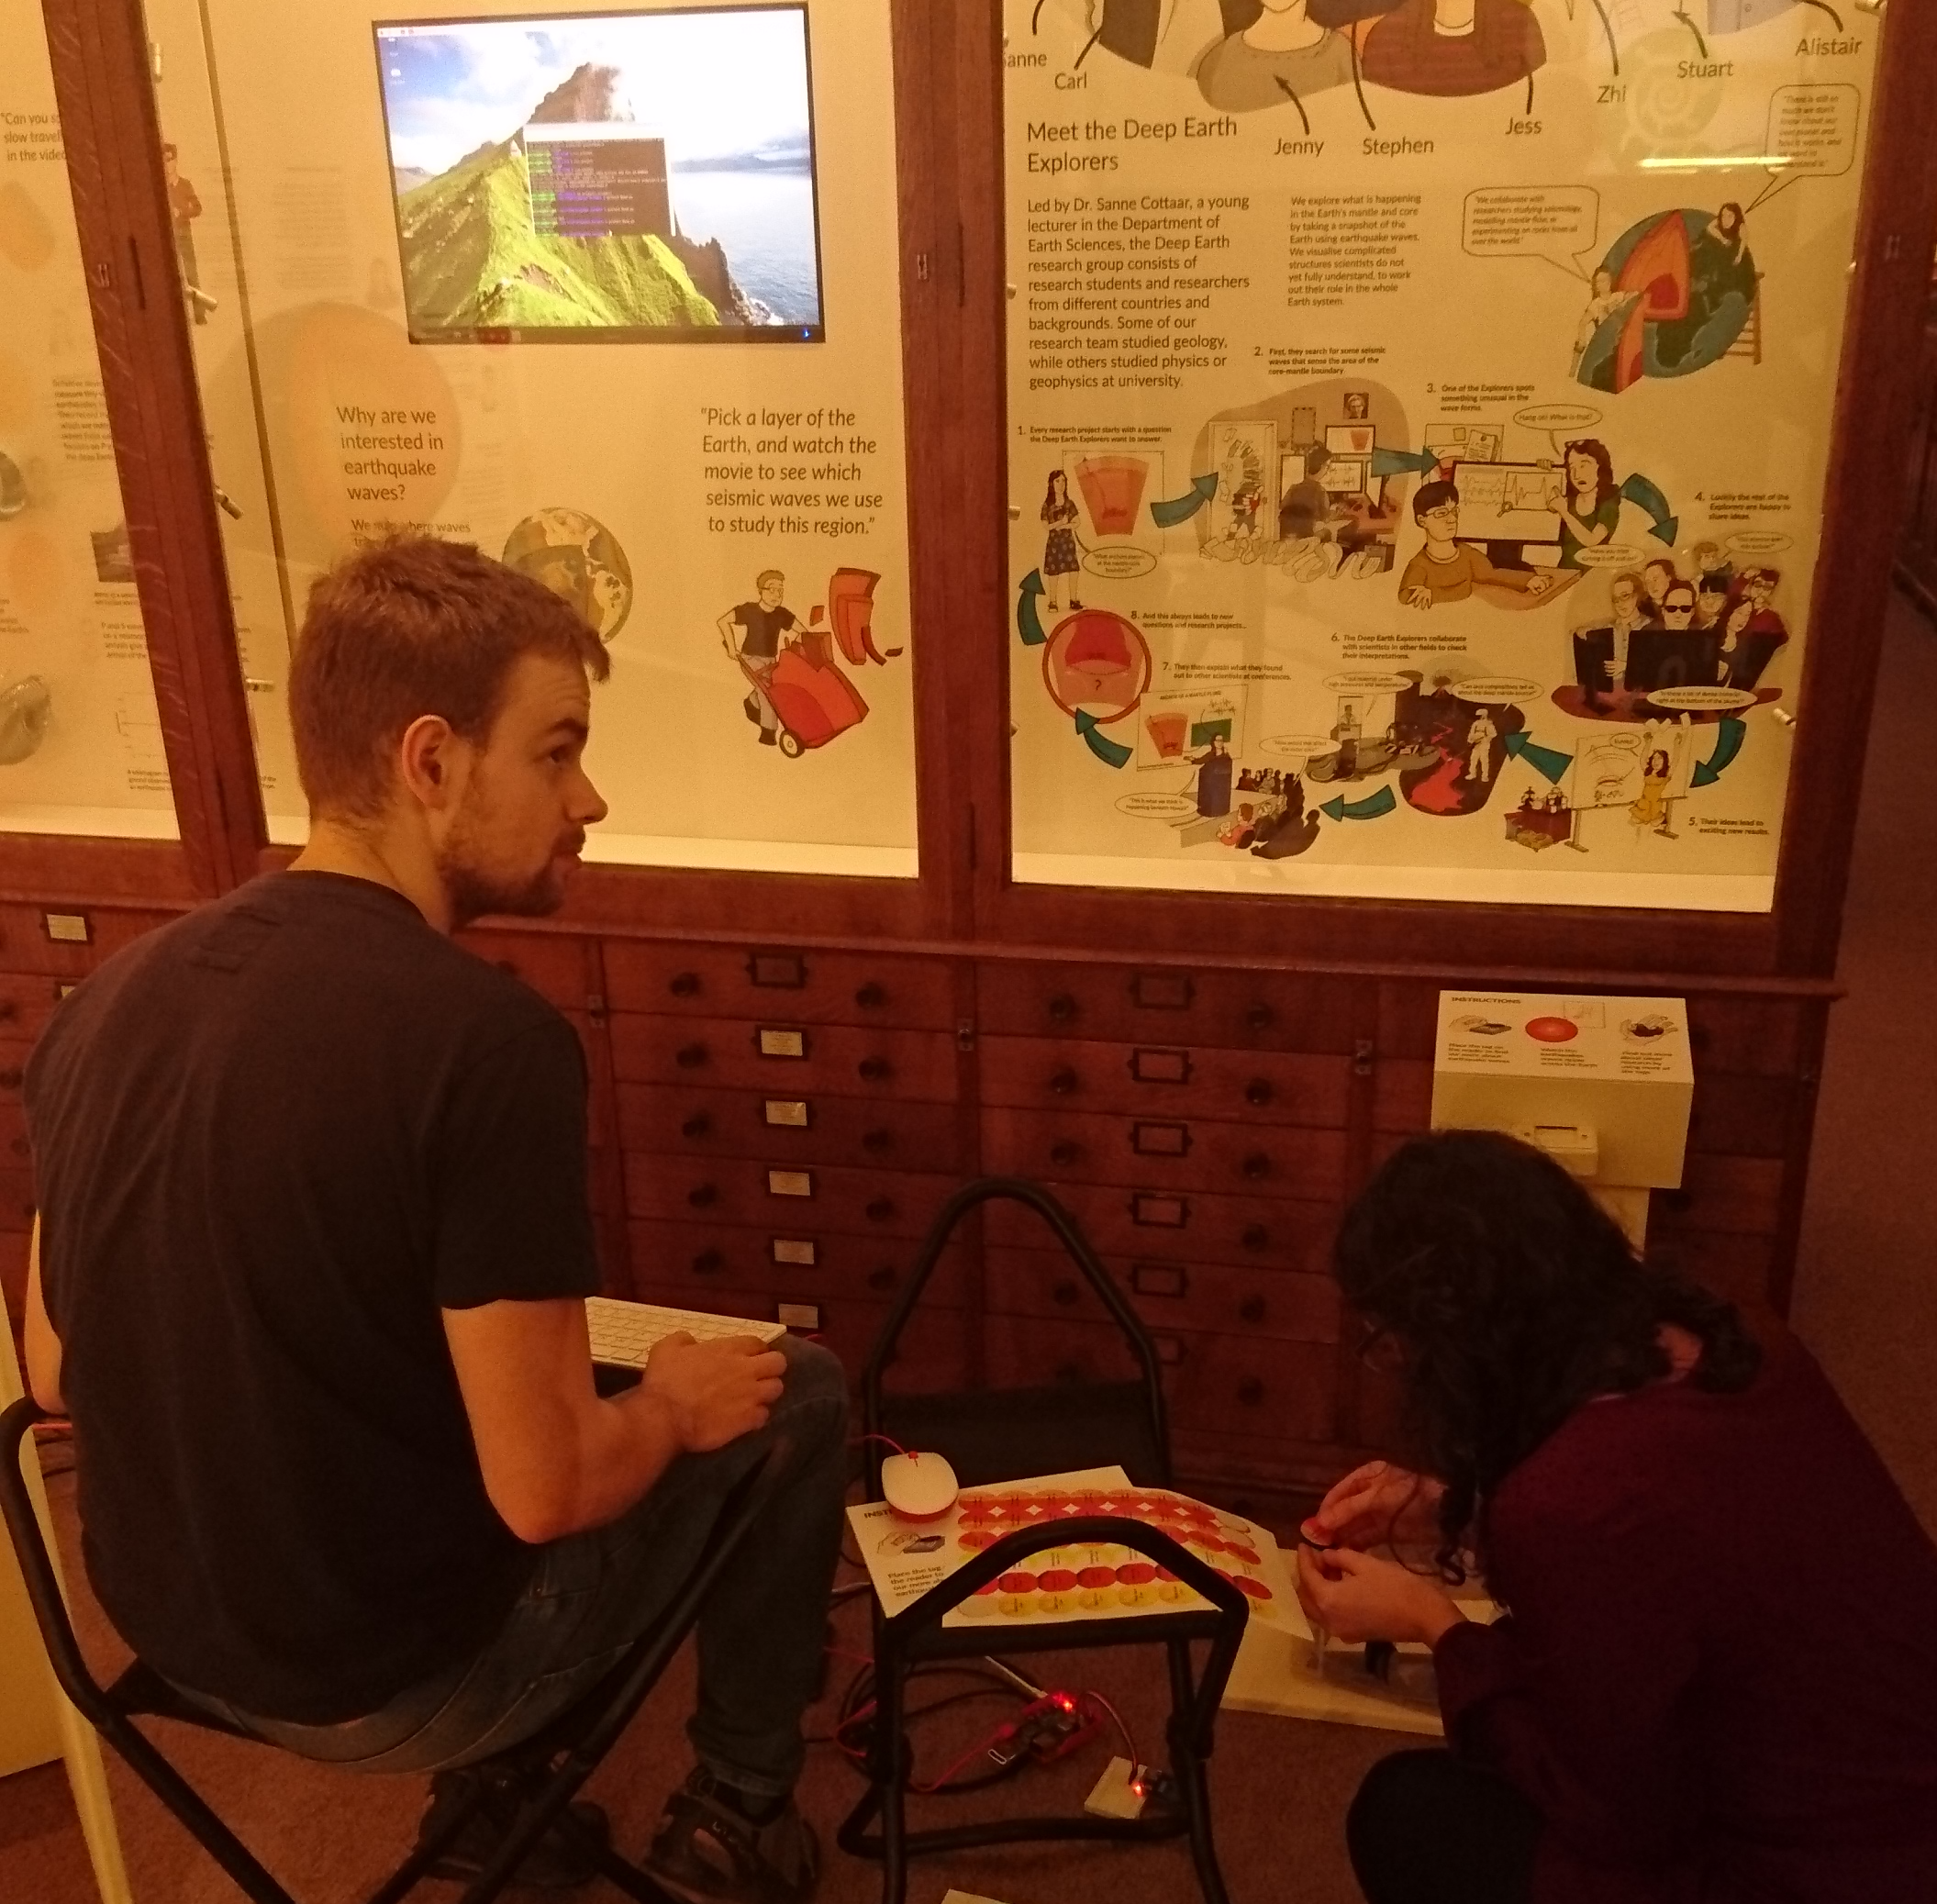
Written with Python on a Raspberry Pi “Explaining Waves” takes visitors on an interactive journey to explore different types of waves and their significance in seismology research. Visitors can touch blue tags containing pictures of zoomed in images of specific parts of the Deep Earth to RFID scanners. In turn, this will reveal certain waves of interest to the public, all set in the context of other seismological discoveries.
Github link: https://github.com/alistairboyce11/explaining_waves
Main contributors: Alistair Boyce and Stuart Russell
Interactive Convection
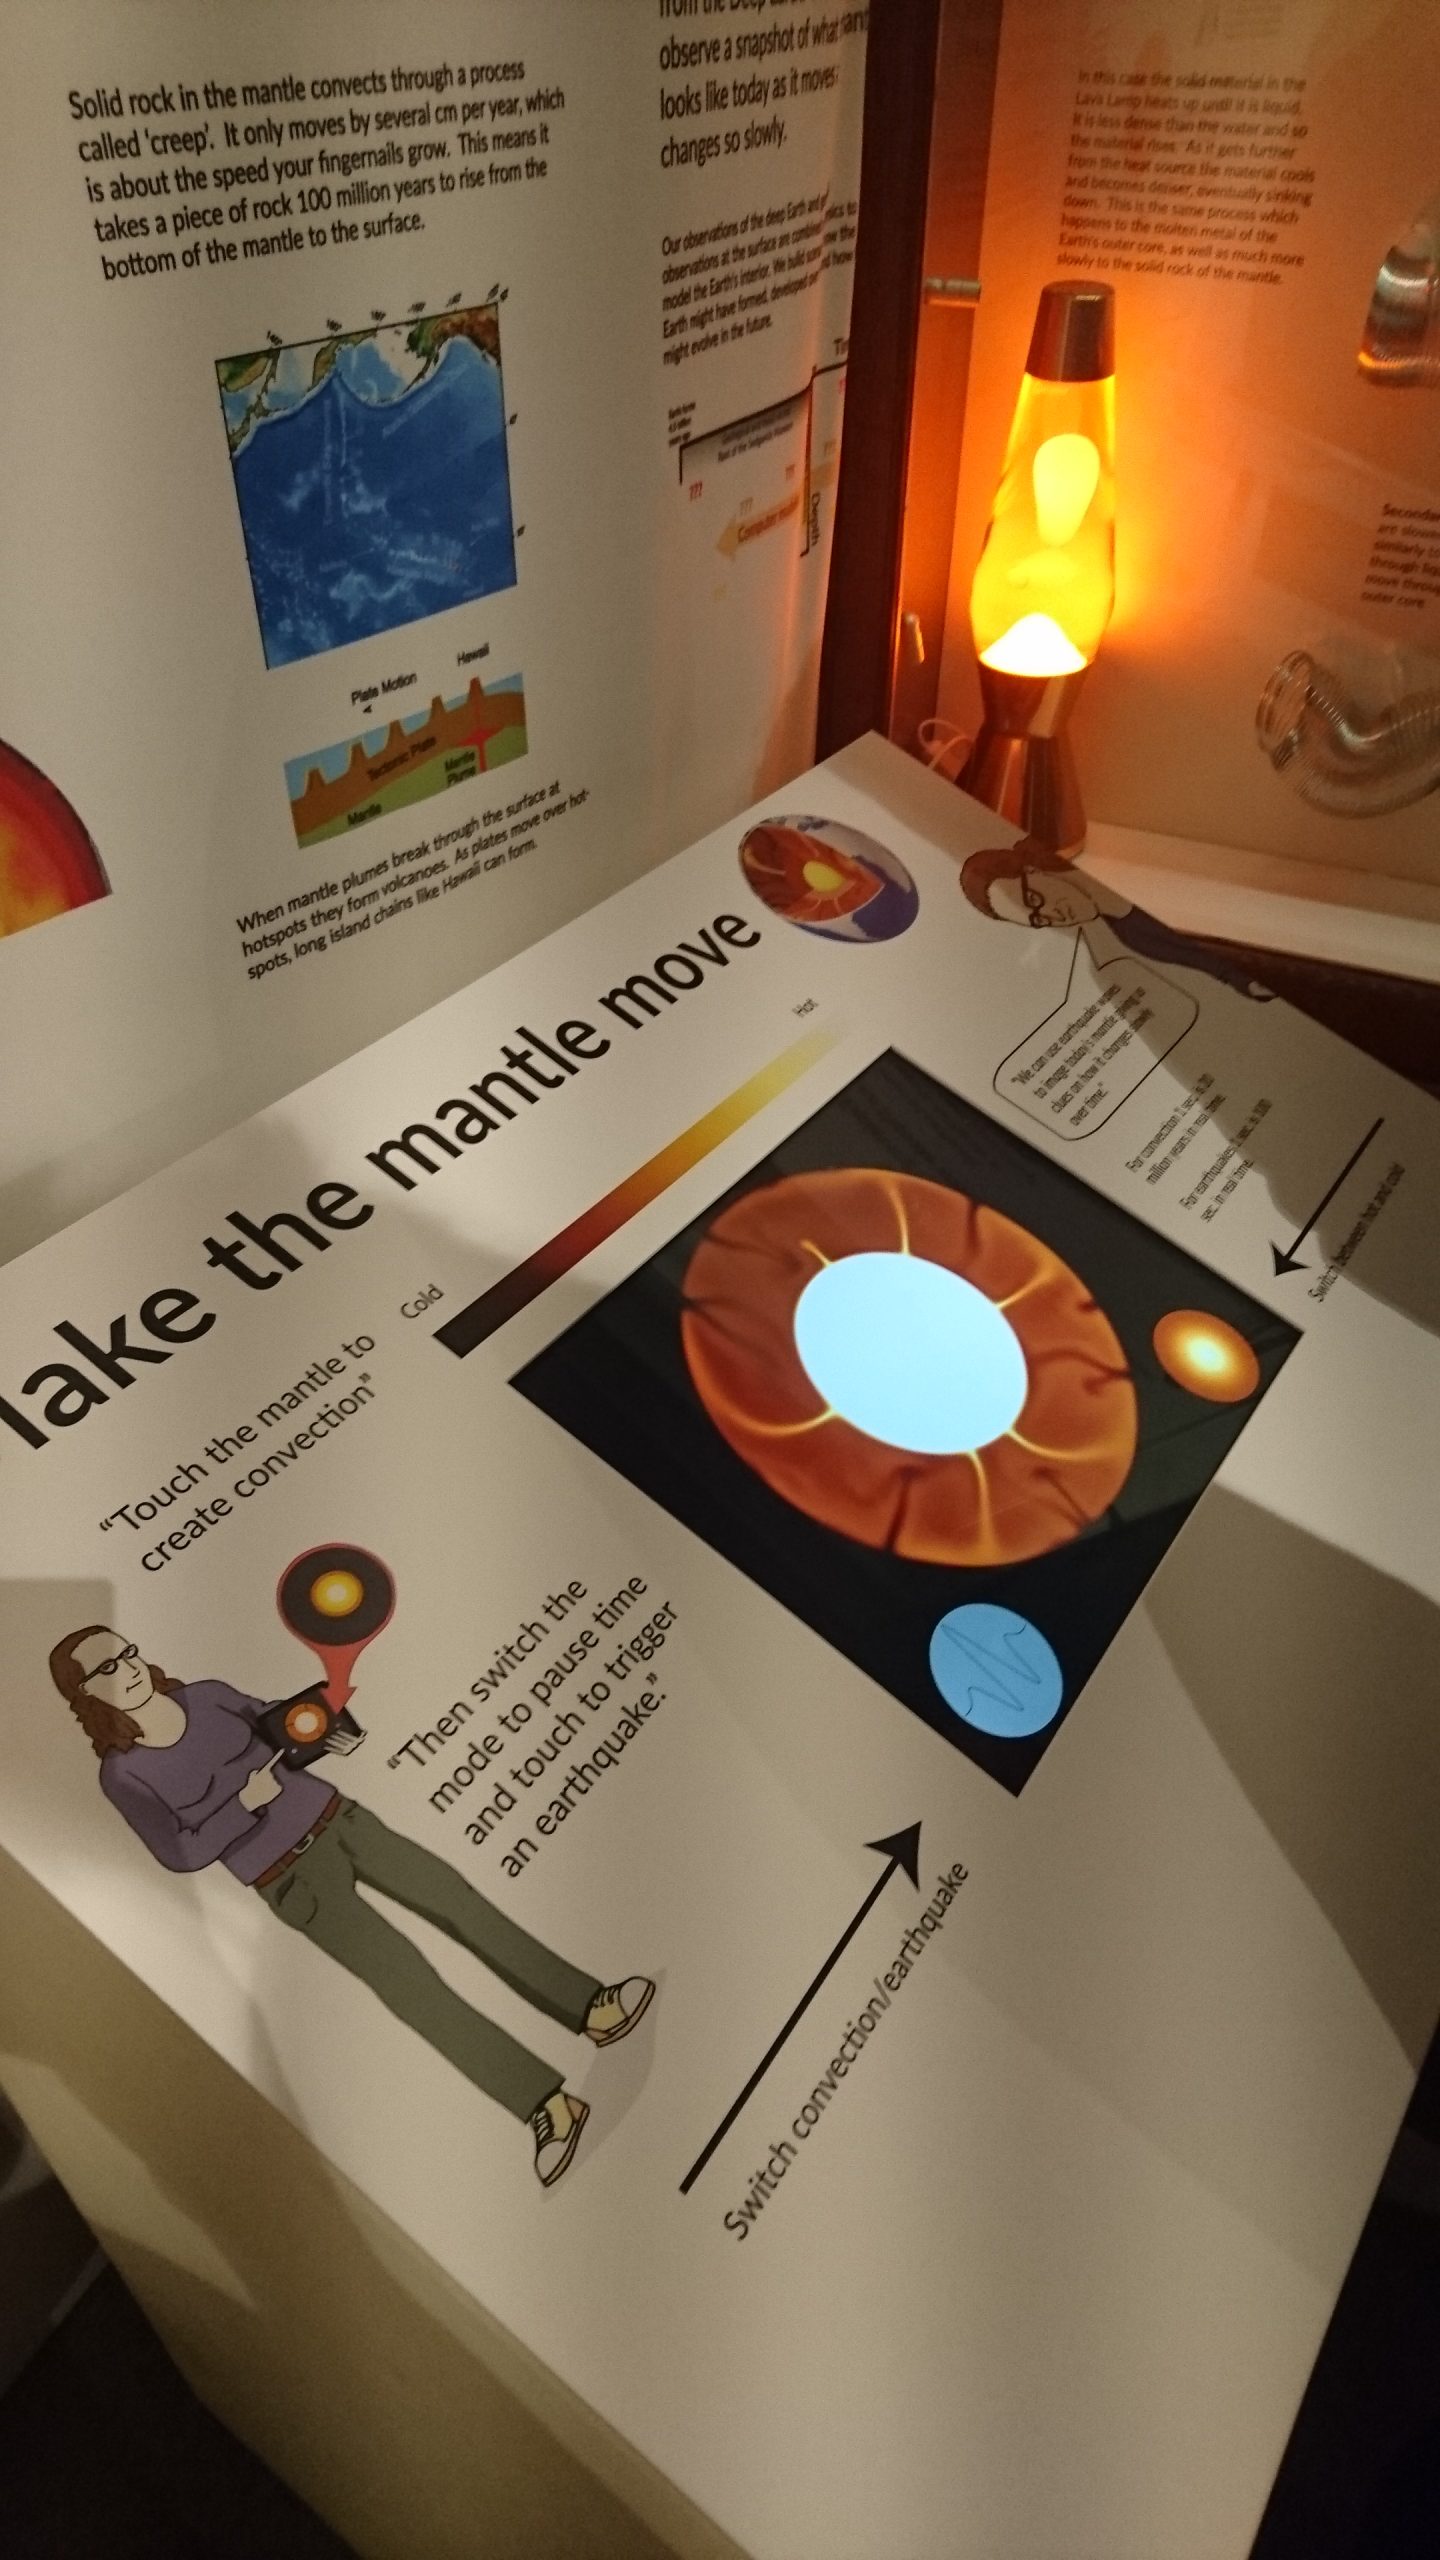
Adapted from Ian Rose’s initial interactive website “Interactive Convection” in HTML, CSS, and JavaScript, “Interactive Convection” sees visitors making surprising playful swells of convection in the solid, rocky mantle. Visitors can also make powerful earthquakes at the tips of their fingers which ripple throughout the Earth resulting in a seismogram reading. Written in C++ and OpenGL.
Github links: https://github.com/ian-r-rose/interactive_earth
Written by Ian R. Rose.
Guided by user evaluation, our touchscreen version is a simplified version from the webpage. This version is specifically setup for the touch screen we are using. If you have interest in the version/code, please contact Sanne Cottaar (sc845@cam.ac.uk).
Life as a Researcher
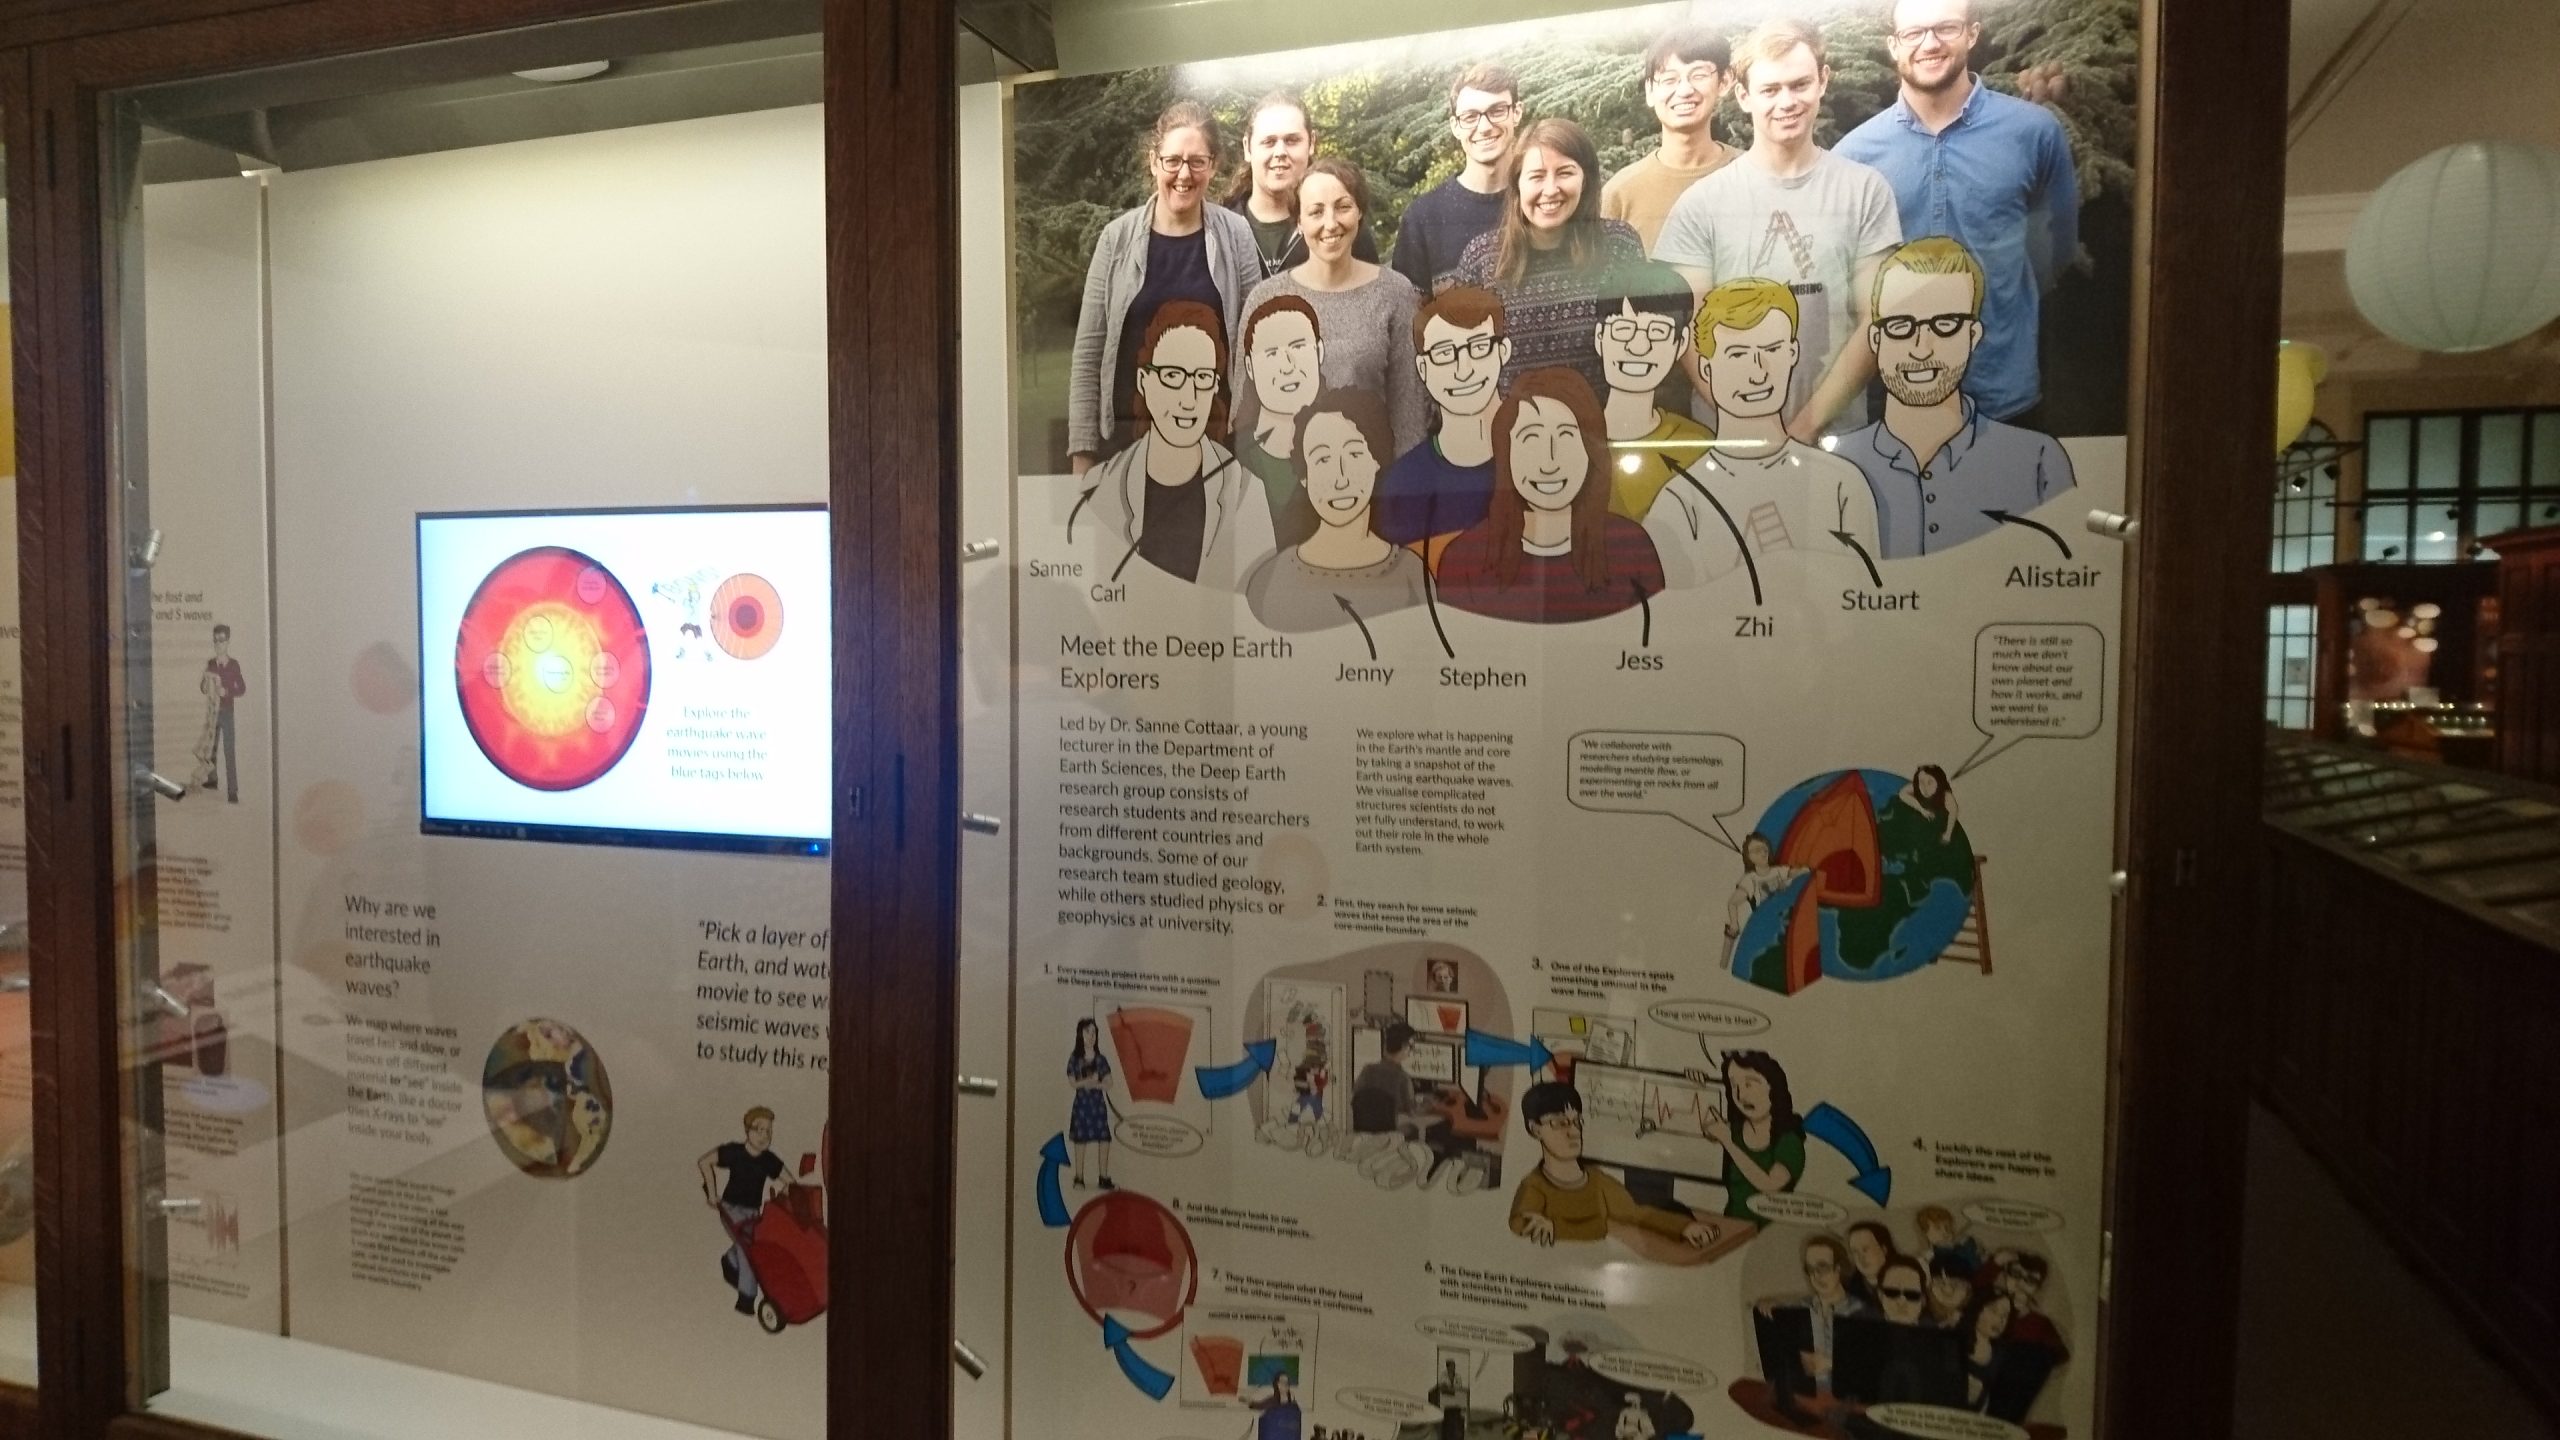
Something that came out of our evaluation with the public was their curiosity around research and the researchers; why they do research, their aims with projects, and what they do day-to-day. Dr Gautier Nicoli made cartoon illustrations to answer these questions. The cartoon storyboard can be viewed here.
This exhibition is made possible by:
